2019.8.28
前情回顾
- 作业:
- 形式:交纸
- 时间:上课交,两周收一次
- 量:不会太多
- 描述性的数据:
- 茎叶图 stem-and-leaf displays
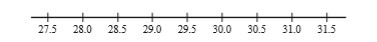
- 克利夫兰(Cleveland提出)点图 dotplots
点图存在理论缺陷:
- 无法特别精确地定位到位置/点精度过高时无法在轴上放点
- 但是现实生活中获取到的数据是有精度截取的
Dotplots
The data set is reasonably small or there are relatively few distinct data values.
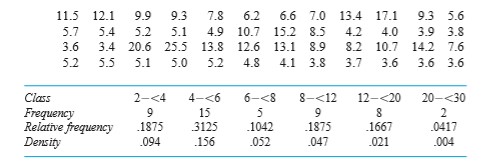
直方图 Histogram
变量类型:
- Discrete (离散) Variable: either is finite or else can be listed in an infinite sequence (有限个/无限序列可列中)
- Continuous Variable: Consisit of an entire interval on the number line. (数轴上的一个区间,不可列)
相对频率
相对频率 = 特定值的数量 / 观测值的数量
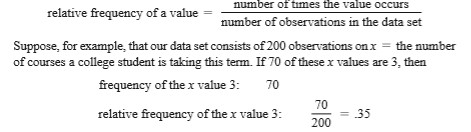
计算相对频率时,由于真实数据需要四舍五入,最终总频率可能不为1(可能超过也可能少于)
- 根据数据是否离散
- 离散情况下可以直接算出频率
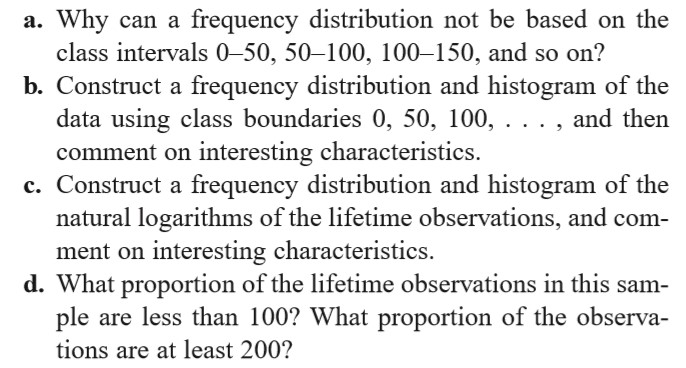
- 连续情况下需要寻找/划分一个合理的区间
- 区间划分常规在
5 ~ 20类或者根号x类 - 部分数据分布不均衡(某些比较集中,某些不叫稀疏)的情况下,采用非等长的分隔(可变区间长度)
- 直方图
长 * 宽能够得到相对频率
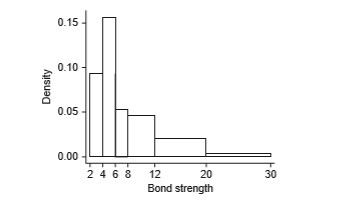
- 区间划分常规在
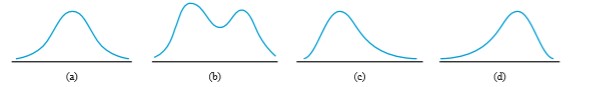
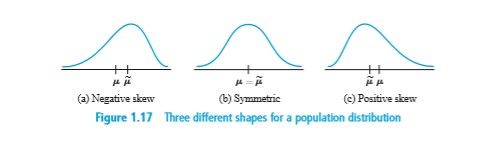
- 根据直方图的形状
- 单峰 / 多峰
- 对称 / 非对称
- 数据分类
- Qualitative Data (定性数据/一元数据):等间隔
- Multivariate Date (多元数据)
参考第11~14章
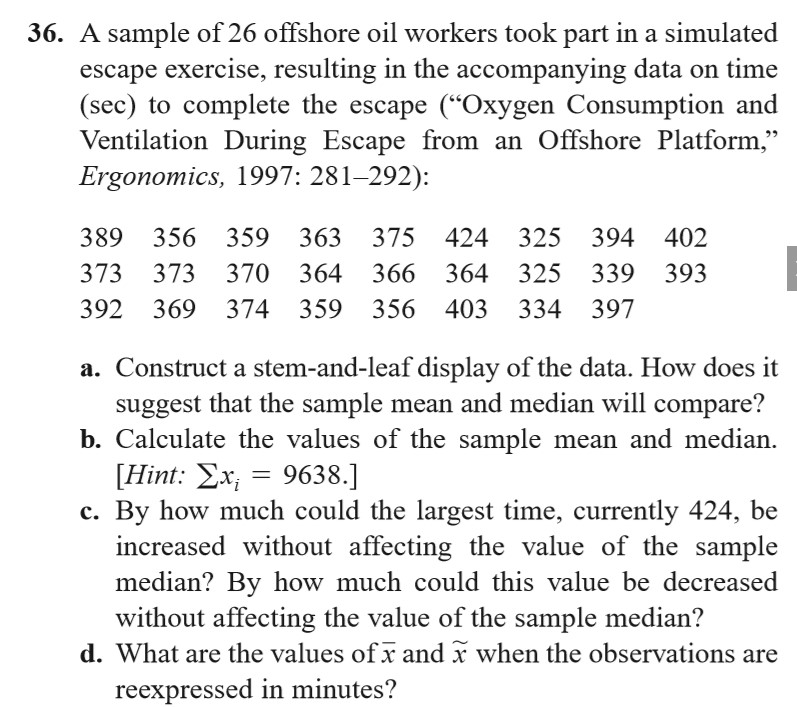
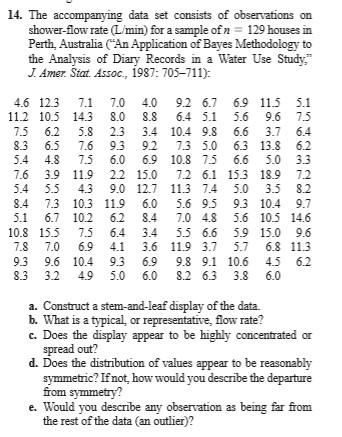
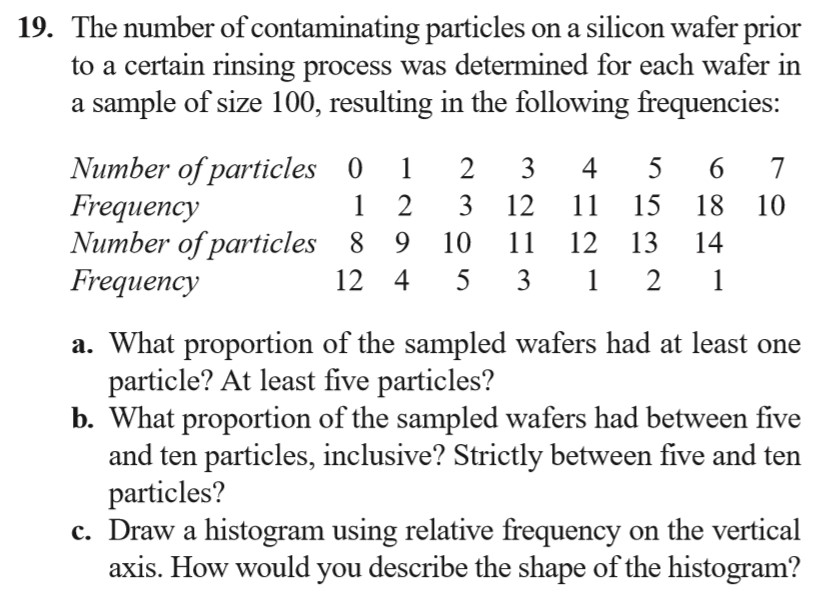
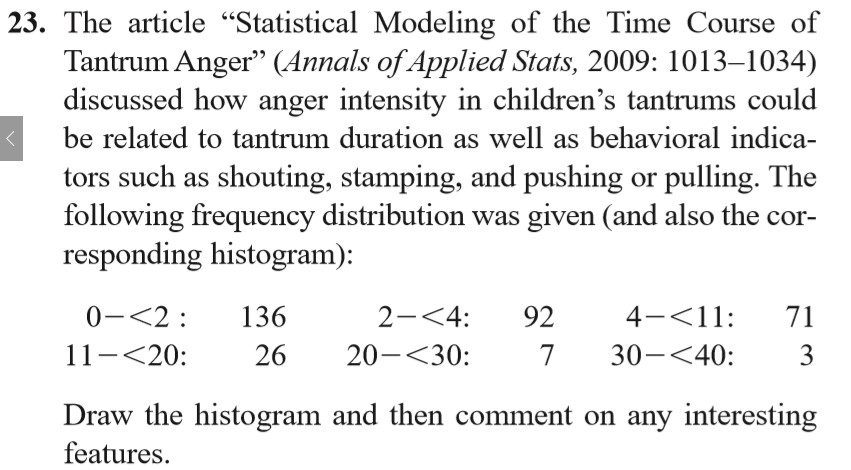
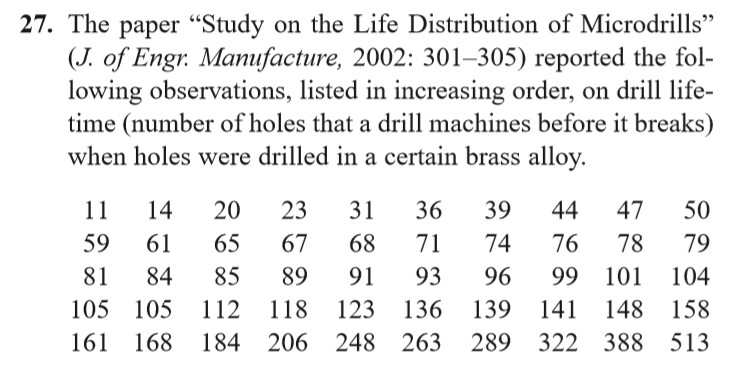
作业
Ex. 14, 19, 23, 27
1.3 Measures of Location
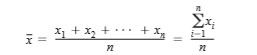
The Mean 均值
- Sample Mean 样本均值:
- 线性:数据不敏感 - 样本中的每一个值都对其有贡献
- 复杂度:O(n)
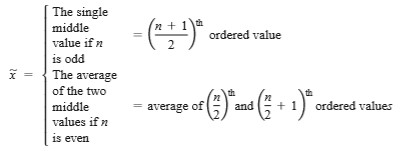
- Sample Median 样本中值(中位数):
- 非线性:数据敏感 - 少量数据能够极大影响该值
- 复杂度:最少 O(nlog(n))
在单峰曲线图中,均值与中值的关系
Other Measures of Location
- Quartiles 四分位数:以中值/均值为中点,进行四等分
- Percentiles 百分数位:把数据分成一百等分,一般是样本数量为
100的倍数 - Trimmed Means 修正后的均值:A compromise between sample mean & sample median (抛弃异常点)
e.g 去掉最高位 & 最低位
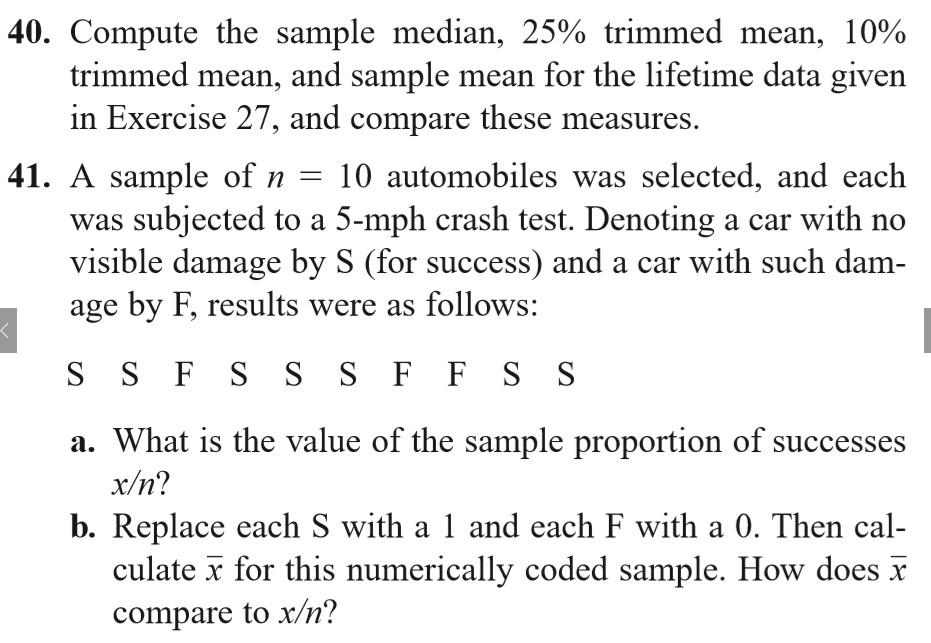
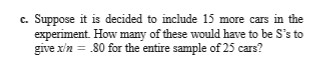
作业
Ex. 36, 40, 41